Developer: Applied Biosystems / Thermo Fisher
Supported platforms: Windows 7 or higher
Download: https://www.thermofisher.com/us/en/home/life-science/sequencing/sanger-sequencing/sanger-dna-sequencing/sanger-sequencing-data-analysis.html
Features
View Quality scores
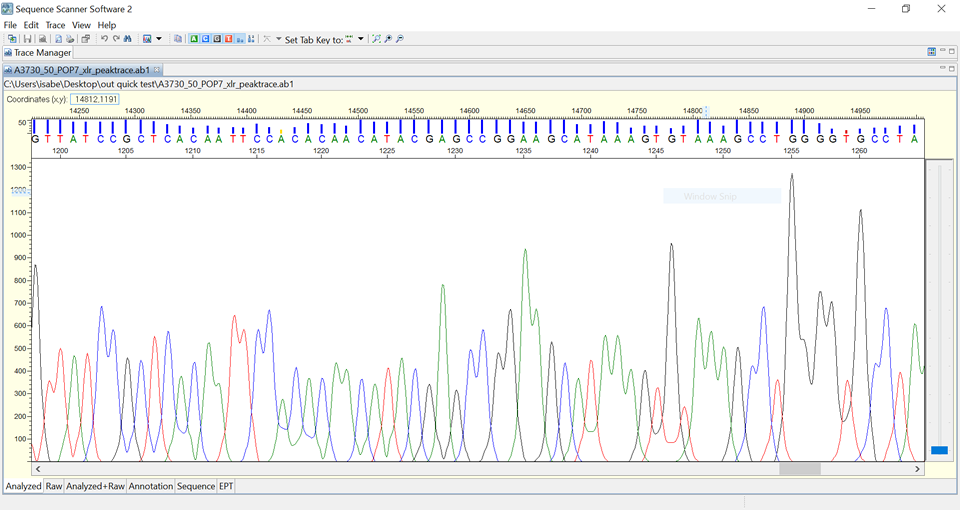
Yes. In the chromatogram view quality scores are displayed on top of the bases using the bar height and a colour code to mark, high, medium and low-quality bases. Numeral values can be toggled on or off. Also in the sequence view the bases are marked in different colours depending on their quality score.
View raw data
Yes. It is possible to display the raw data together with the processed chromatogram. This makes it easy to find a certain region in the chromatogram and raw data and compare them. It is also possible to compare the raw data of several traces in a thumbnail view.
Assembly
No.
Input file formats
Only .ab1 files can be imported.
Output file formats
Sequence and Chromatogram: fsta, .qual, .seq, .phd.1, jpg, and .pdf formats.
Reports: .pdf and html
Trimming
Yes, but only by selecting the regions to be trimmed manually.
Integrated Blast
No
Open multiple windows
Yes, this is possible using the tile view option. Moreover, the raw data channel and chromatogram can be viewed at the same time. It is also possible to compare the raw data of several traces in a thumbnail view.
Edit bases
Yes
ABI limits (regions outside of clear range region are displayed in grey)
Yes
Other functions
- Quality report
- Select and view only one channel
- Thumbnail viewing and sorting
- Six different viewing
Cost
Free
Comments
Sequence scanner has all the basic features of a trace viewer. Other viewers like chromas or Finch TV are more intuitive to use, but depending on your needs Sequence scanner has some interesting features. Its most differentiating features are the raw data viewing options and the possibility to get quality reports.