 Summary
- PeakTrace increases total sequence read length by 20% in comparison to KB.
- PeakTrace is a more accurate basecaller than KB.
- PeakTrace is a superior basecaller to KB.
Introduction
The use of improved basecallers offers a simple method for increasing trace read length. Before a new basecaller can be used in production, it needs to be validated to ensure that the predicted quality scores match the actual or observed quality scores. Such a process is known as quality score mapping [1].
PeakTrace is an alternative basecaller to the current “gold standard” basecaller for Sanger DNA sequencing, ABI’s KB basecaller. The aim of this study was to validate the PeakTrace basecall and compare the quality score mapping to that obtained using the KB basecaller.
Methodology
DNA sequencing traces collected from plasmid subclones derived from the salmon BAC CHORI214-107E05 and BAC CHORI214-109F19 were basecalled using either KB v1.2 or PeakTrace 4.25 (Nucleics, Australia). All traces were pre-screen using the QualTrace QC software (Nucleics) to remove failed reactions or traces containing mixed peak signal. To ensure that only like-against-like sequences were compared, traces that PeakTrace did not improve by more than 10 more Q20+ bases were excluded. These criteria excluded less than 1% of the trace sequences.
All KB and PeakTrace derived sequences were BLAST [2] aligned to either the BAC CHORI214-107E05 and BAC CHORI214-109F19 consensus sequence. Sequences that could not be aligned to either of these BAC sequences were excluded from further analysis (almost all of the unalignable traces aligned to E. coli K12 genomic DNA). Finally, any KB and PeakTrace basecalled sequences that displayed putative Q40+ errors were examined manually to ensure any errors were not due to BLAST misalignment. A total of 1643 traces passed these four screening criteria providing more than 1.5 million alignable bases.
The BLAST aligned sequences were used to calculate the total aligned bases and the observed basecalling errors using the approach of Ewing and Green [1]. In brief, for every aligned base the total count of correct and incorrect basecalls was recorded (observed quality or Q values). These calculated error rates were compared to both basecaller’s predicted error rates (predicted Q scores) to determine the accuracy of the quality score prediction (Q score mapping).
Results
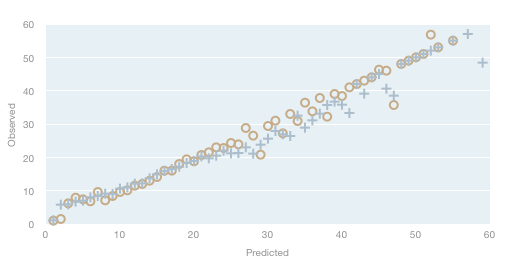
The results of the Q score mappings are shown in Table 1 and 2. PeakTrace was more accurate at predicted the true error rate than KB (Figure 1). This accuracy difference was particular noticeable in the mid-range quality scores (Q20 to Q30) where KB over predicted the sequence quality (i.e. a KB predicted Q29 base had a true error rate at the Q24 level). This bias in predicating the true error rate causes KB to classify traces as being of high quality than the true error rate reflects.

Figure 1. Quality mapping of observed and predicted quality scores. Observed quality scores without observed error or basecalls were mapped at the predicted quality value. PeakTrace (circles); KB (crosses).
The average total aligned read length for PeakTrace basecalled traces was 1030 bases. The average aligned Q20+ read length for PeakTrace basecalled traces was 954 bases. This is significantly greater than the average aligned read length for KB basecalled traces (using the same 1643 traces) of 867 bases, with an average aligned Q20+ read length of 795 bases. PeakTrace increases the total aligned read length of this trace data set by 18.7% and Q20+ read length by 19.9%. This improvement is an underestimation of the true differences since KB over predicts then number of Q20+ bases. Even when the predicted quality scores are ignored, PeakTrace basecalling improves the total alignable sequence by more than 130 bases per trace.
Table 1. Mapping of 1643 PeakTrace basecalled traces on BAC CHORI214-107E05 and BAC CHORI214-109F19.
| Predicted Q Score | Base Count | Errors | True Q Score |
| 1 | 1 | 0 | 0 |
| 2 | 21 | 15 | 1.5 |
| 3 | 80 | 19 | 6.2 |
| 4 | 1027 | 165 | 7.9 |
| 5 | 2400 | 439 | 7.4 |
| 6 | 5296 | 1099 | 6.8 |
| 7 | 3138 | 348 | 9.6 |
| 8 | 33708 | 6606 | 7.1 |
| 9 | 11406 | 1650 | 8.4 |
| 10 | 8204 | 906 | 9.6 |
| 11 | 11496 | 1115 | 10.1 |
| 12 | 10699 | 751 | 11.5 |
| 13 | 15127 | 947 | 12 |
| 14 | 8423 | 424 | 13 |
| 15 | 5419 | 211 | 14.1 |
| 16 | 2956 | 74 | 16 |
| 17 | 1783 | 45 | 16 |
| 18 | 3019 | 48 | 18 |
| 19 | 615 | 7 | 19.4 |
| 20 | 44789 | 588 | 18.8 |
| 21 | 4489 | 38 | 20.7 |
| 22 | 9383 | 67 | 21.5 |
| 23 | 7965 | 40 | 23 |
| 24 | 3429 | 18 | 22.8 |
| 25 | 17882 | 67 | 24.3 |
| 26 | 494 | 2 | 23.9 |
| 27 | 2292 | 3 | 28.8 |
| 28 | 903 | 2 | 26.5 |
| 29 | 714 | 6 | 20.8 |
| 30 | 43956 | 51 | 29.4 |
| 31 | 997 | 0 | 0 |
| 32 | 5759 | 11 | 27.2 |
| 33 | 1382 | 0 | 0 |
| 34 | 1230 | 1 | 30.9 |
| 35 | 21900 | 5 | 36.4 |
| 36 | 2398 | 1 | 33.8 |
| 37 | 6001 | 1 | 37.8 |
| 38 | 3324 | 2 | 32.2 |
| 39 | 1288 | 0 | 0 |
| 40 | 41047 | 6 | 38.4 |
| 41 | 5233 | 0 | 0 |
| 42 | 1504 | 0 | 0 |
| 43 | 5721 | 0 | 0 |
| 44 | 1972 | 0 | 0 |
| 45 | 42940 | 1 | 46.3 |
| 46 | 289 | 0 | 0 |
| 47 | 3692 | 1 | 35.7 |
| 48 | 149 | 0 | 0 |
| 49 | 4317 | 0 | 0 |
| 50 | 84302 | 0 | 0 |
| 51 | 259 | 0 | 0 |
| 52 | 479835 | 1 | 56.8 |
| 53 | 973 | 0 | 0 |
| 54 | 1073 | 0 | 0 |
| 55 | 714262 | 0 | 0 |
| Q20+ | 1568143 | 912 | |
| Total | 1692961 | 15781 |
Table 2. Mapping of 1643 traces KB basecalled on BAC CHORI214-107E05 and BAC CHORI214-109F19.
| Predicted Q Score | Base Count | Errors | True Q Score |
| 1 | 332 | 260 | 1.1 |
| 2 | 533 | 141 | 5.8 |
| 3 | 3815 | 974 | 5.9 |
| 4 | 8190 | 1739 | 6.7 |
| 5 | 7151 | 1431 | 7 |
| 6 | 8951 | 1424 | 8 |
| 7 | 8830 | 1286 | 8.4 |
| 8 | 7725 | 959 | 9.1 |
| 9 | 6787 | 850 | 9 |
| 10 | 7629 | 662 | 10.6 |
| 11 | 6450 | 512 | 11 |
| 12 | 6878 | 425 | 12.1 |
| 13 | 6899 | 414 | 12.2 |
| 14 | 6503 | 276 | 13.7 |
| 15 | 5330 | 171 | 14.9 |
| 16 | 6404 | 163 | 15.9 |
| 17 | 6407 | 145 | 16.5 |
| 18 | 6807 | 130 | 17.2 |
| 19 | 6648 | 98 | 18.3 |
| 20 | 6793 | 88 | 18.9 |
| 21 | 6608 | 61 | 20.3 |
| 22 | 5906 | 63 | 19.7 |
| 23 | 7303 | 65 | 20.5 |
| 24 | 7353 | 46 | 22 |
| 25 | 6526 | 50 | 21.2 |
| 26 | 6751 | 50 | 21.3 |
| 27 | 6522 | 33 | 23 |
| 28 | 9110 | 70 | 21.1 |
| 29 | 24515 | 102 | 23.8 |
| 30 | 15823 | 44 | 25.6 |
| 31 | 9285 | 15 | 27.9 |
| 32 | 8860 | 18 | 26.9 |
| 33 | 8686 | 20 | 26.4 |
| 34 | 7179 | 4 | 32.5 |
| 35 | 5431 | 7 | 28.9 |
| 36 | 12957 | 10 | 31.1 |
| 37 | 8234 | 4 | 33.1 |
| 38 | 11122 | 3 | 35.7 |
| 39 | 9400 | 2 | 36.7 |
| 40 | 7524 | 2 | 35.8 |
| 41 | 12751 | 6 | 33.3 |
| 42 | 4541 | 0 | 0 |
| 43 | 16097 | 2 | 39.1 |
| 44 | 10576 | 0 | 0 |
| 45 | 9207 | 0 | 0 |
| 46 | 23183 | 2 | 40.6 |
| 47 | 21292 | 3 | 38.5 |
| 48 | 4343 | 0 | 0 |
| 49 | 5756 | 0 | 0 |
| 50 | 8886 | 0 | 0 |
| 51 | 15279 | 0 | 0 |
| 52 | 22520 | 0 | 0 |
| 53 | 47587 | 0 | 0 |
| 55 | 18533 | 0 | 0 |
| 57 | 99393 | 0 | 0 |
| 59 | 69445 | 1 | 48.4 |
| 61 | 726458 | 0 | 0 |
| Q20+ | 1307735 | 771 | |
| Total | 1426004 | 12831 |
Conclusion
PeakTrace offers improved read lengths of 20% in alignable Q20+ bases over that obtained from the KB basecaller.
It should be noted that the reads in the test trace data set were prematurely stopped for best use with PeakTrace. Modification of the run module to extend the data collection time for an additional two to three minutes would have further increased the performance of PeakTrace relative to KB from 20% to 30%.
References
- Ewing B, Green P. (1998): Base-calling of automated sequencer traces using phred. II. Error probabilities. Genome Res. 8:186-194.
- Altschul, S.F., Gish, W., Miller, W., Myers, E.W. & Lipman, D.J. (1990): Basic local alignment search tool. J. Mol. Biol. 215:403-410