• Skip to main content
  • Skip to primary sidebar

Nucleics

  • PeakTrace
    • About PeakTrace
    • PeakTrace Online
    • PeakTrace Online Pro
    • Online Pro for RP customers
    • PeakTrace 6
    • PeakTrace:Box
    • PeakTrace RP
    • PeakTrace for Chromas
    • Buy PeakTrace
    • Why use PeakTrace?
    • Validation of PeakTrace
    • PeakTrace FAQ
    • PeakTrace In Depth
  • DNA Sequencing Products
    • PeakTrace Basecaller
    • PeakTrace:Box
    • PeakTrace RP
    • PeakTrace for Chromas
    • QualTrace
    • LongTrace
    • CounterTrace
    • dLUTE SEQ
    • UniSeq
    • ASIN
  • Support & Services
    • PeakTrace Online Pro Registration
    • QualTrace III Online
    • DNA Sequencing Troubleshooting Guide
    • PeakTrace RP Downloads
    • PeakTrace:Box Downloads
    • Trace Viewers
    • User Manuals
    • Help Guides
      • How to Install Auto PeakTrace 6
      • How to Upgrade to Auto PeakTrace 6
      • How to Update the PeakTrace License on Linux
      • How to Generate a cmDust File
      • Online Activation of Auto PeakTrace 6
      • Auto PeakTrace 6 Online Activation Guide
      • DNA Sequencing Protocols
        • DNA Sequencing Protocol Tips
        • Exonuclease I – Shrimp Alkaline Phosphatase Clean Up of PCR Products
        • Tris EDTA DNA Sequencing Resuspension Buffer
        • DNA Sequencing Reaction Clean-up using Phenol & Butanol
    • DNA Sequencing Service Reviews
    • Software Downloads
    • MSDS
    • Services
      • Genomics Sequencing
      • Bioinformatics
  • Forum
    • Register
    • Login
    • PeakTrace Basecaller Forum
    • PeakTrace:Box Forum
    • Auto PeakTrace RP Forum
    • QualTrace Forum
    • DNA Sequencing Forum
    • DNA Sequencing Software
    • PCR Forum
    • DNA Isolation Forum
    • LongTrace Forum
    • dLUTE SEQ Forum
  • About
    • Contact
    • News
    • Jobs
    • Nucleics Privacy Policy
Buy PeakTrace

Daniel

In Depth: Extra Smoothing Part I

December 8, 2015 By Daniel

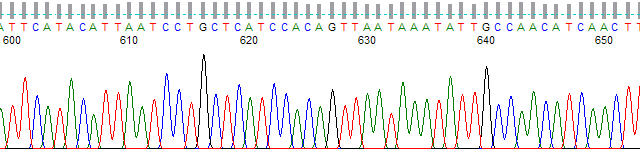
PeakTrace chromatogram from bases 600 to 650 using the no peak resolution setting

An interesting concern we get from customers about the PeakTrace Basecaller™ is that the peaks are “too sharp” at the end of the trace. This has always puzzled us because what is the criteria for a peak being too sharp? Should a trace processed and basecalled by PeakTrace look exactly the same as a trace processed and basecalled by the KB Basecaller™, or should it look different as it is a different basecaller? While we are of the opinion that a PeakTrace basecalled trace should look different (and provide the best trace the basecaller can make), we do understand that some users would like the better basecalling offered by PeakTrace, but want a trace that looks more like a KB trace. There are two ways of making a PeakTrace basecalled trace look like a KB trace file; use no peak resolution, or for more control, use extra smoothing.

In Part I of this article we will explore the use of the no peak resolution setting to achieve a KB-like trace appearance.

Using No Peak Resolution

The no peak resolution setting of PeakTrace outputs a trace with the peaks based on the resolution found in the raw data channel with only minor processing. The basecalling is identical to that obtained using standard PeakTrace basecalling, but with a reduced peak resolution that approximates that provided by KB.

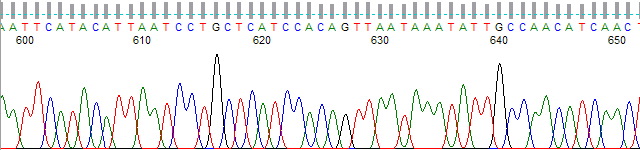
Figures 1 to 3 show an example trace processed with the KB Basecaller,  PeakTrace Basecaller using the no peak resolution option, and PeakTrace Basecaller using standard settings, respectively. The resolution and basecall quality are very similar at this point in the trace between all three.
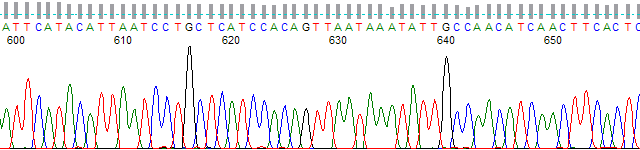
KB Trace t base 600.
Figure 1. KB trace at bases 600 − 660.
PeakTrace chromatogram from bases 600 to 650 using the no peak resolution setting
Figure 2. PeakTrace trace at base 600 − 660 using the no peak resolution setting.
Figure 3. PeakTrace processed trace with standard settings.
Figure 3. PeakTrace trace at base 600 − 660 using  standard settings.

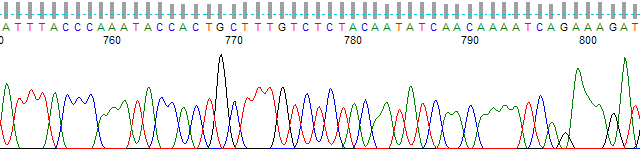
Figures 4 to 6 show the same trace further down the trace using the same three basecaller settings.
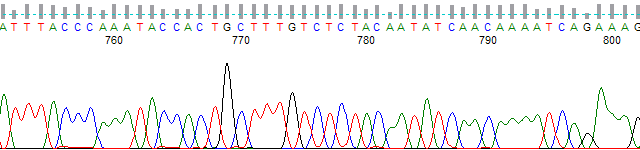
KB chromatogram from bases 755 to 800, with broad, poorly resolved peaks
Figure 4. KB trace at bases 750 − 800.
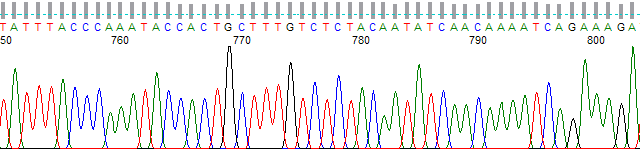
PeakTrace chromatogram from bases 755 to 800 using the no peak resolution setting, with broad, KB-like peaks
Figure 5. PeakTrace trace at bases 750 − 800 using the no peak resolution setting.
PeakTrace chromatogram from bases 750 to 800 using standard settings, with sharp, well-resolved peaks
Figure 6. PeakTrace trace at bases 750 − 800 using standard settings.

By base 800 the peak resolution provided by standard PeakTrace basecalling (Figure 6) is considerably better than that provided by the KB Basecaller (Figure 4), while that provided by the no peak resolution setting (Figure 5) is very similar to that provided by KB. The quality scores are considerably higher with both PeakTrace traces (shown by the height of the gray bars above each basecall), reflecting the superior basecalling provided by PeakTrace.

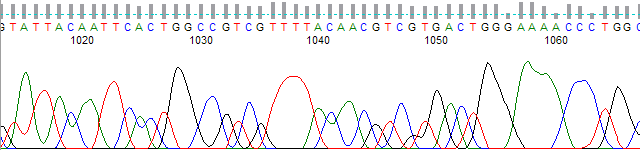
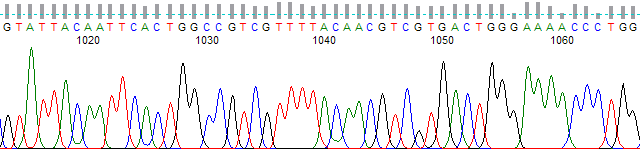
Figures 7 to 9 show the same trace past base 1000. The standard PeakTrace settings (Figure 9) provide much better resolved peaks with superior basecalling to that provided by KB. The no peak resolution setting (Figure 8) provides an identical basecall to the standard setting, but the trace looks very similar to a KB trace (Figure 7). It is worth noting that KB has made a basecall error at base position 1029 and has called 2G peaks as 3G peaks. Both PeakTrace traces correctly call this as 2 G bases. The correct basecall was determined by comparing the trace sequence with the known consensus sequencing.
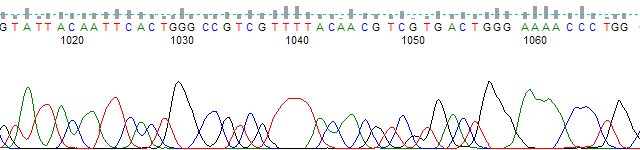
KB trace at base 1010 − 1070.
Figure 7. KB trace at bases 1010 − 1070.
PeakTrace trace at bases 1010 − 1070.
Figure 8. PeakTrace trace at bases 1010 − 1070 using the no peak resolution setting.
PeakTrace trace at bases 1010 − 1070 using standard settings.
Figure 9. PeakTrace trace at bases 1010 − 1070 using standard settings.

Conclusion

While the no peak resolution setting is able to provide a trace that is similar in appearance to a KB trace, it does not provide any user control over the level of peak resolution.  For some applications it is desirable to provide good peak resolution to a certain point in the trace and then reduce the peak resolution. This level of fine control is offered by the new extra smoothing setting within PeakTrace 6 which we will explore in Extra Smoothing Part II.

Filed Under: In Depth, PeakTrace, PeakTrace RP

In Depth: Extra Normalization

December 1, 2015 By Daniel

KB chromatogram from bases 55 to 105 with standard normalization

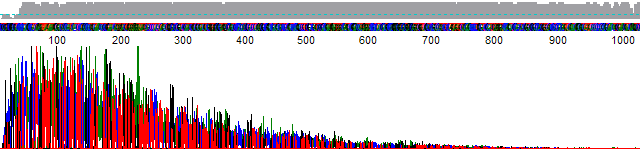
A common problem with Sanger DNA sequencing is a rapid falloff in peak signal strength – what is known colloquially as a “ski-slope” trace. This problem can often be difficult to see in the processed data channels because of basecaller normalization, but is very easy to see in the raw channels. Figure 1 shows a typical example of this effect in the raw channels.

True profile of trace
Figure 1. Rapid falloff of peak signal in the raw trace channel.

While there are many causes for rapid falloff in peak signal, the end result is the peaks at the end of the trace are very weak and can be close, or at, the detector noise level. This not only makes it hard to determine the basecall, it also makes it difficult to accurately normalize the peak heights in the raw channel.

The PeakTrace Basecaller™ and the KB Basecaller™ have historically had a very different philosophy to normalization of the rapid falloff traces. The KB Basecaller will normalize all the peaks to the same height no matter how extreme the signal declines, while PeakTrace limited the normalization to a factor of 40. On extreme signal decline traces (e.g. where the average peak heights fall from 25,000 to 25) PeakTrace would not “pull up” the weak peaks to the same extent as KB. The reason for this difference is we believe that the user should be aware that the trace had serious issues, and not just have the basecaller “sweep the dirt under the rug” and make the bad trace look good. We see many facilities unknowingly produce very poor traces because KB has hidden this problem from them.

Using Extra Normalization with PeakTrace Basecalling

With the introduction of QualTrace III into PeakTrace 6 it is possible to both fully correct the peak heights while also reporting on  production issues like the rapid falloff of trace signal. Figure 2 shows how PeakTrace 5 would normalize and Figure 3 shows the same trace normalized using the PeakTrace 6 Extra Normalization setting.

PeakTrace 5 peak normalization.
Figure 2. PeakTrace 5 peak normalization.
PeakTrace 6 Extra Normalization.
Figure 3. PeakTrace 6 Extra Normalization.

The extra normalization setting also improves inter-channel and inter-peak normalization. Figure 4 shows a section of an imbalanced trace normalization by PeakTrace 5. Figure 5 shows the same trace normalized using the PeakTrace 6 extra normalization option. The C and G channels are better normalized using the extra normalization option.

PeakTrace 5 peak normalization.
Figure 4. PeakTrace 5 peak normalization.
PeakTrace 6 chromatogram from bases 87 to 135 with extra normalization, giving more even peak heights
Figure 5. PeakTrace 6 extra normalization.

Using Extra Normalization with KB Basecalling

The extra normalization setting can also be used with KB basecalled traces to improve their appearance by selecting the ABI/KB basecaller option within PeakTrace 6. Like the clean baseline setting this will not change the base or quality scores, but it will improve the appearance of the trace file. Figure 6 shows a typical KB trace file using standard KB normalization. Figure 7 shows the same trace, but with the extra normalization option used. While not dramatically different, the inter-channel and inter-peak heights are more consistent when using extra normalization.

KB chromatogram from bases 55 to 105 with standard normalization
Figure 6. KB trace with standard normalization.
KB trace with extra normalization.
Figure 7. KB trace with extra normalization.

Pitfalls with using Extra Normalization

There are two potential pitfalls with using extra normalization:

  1. You might miss production issues that are causing your signal intensity to drop off rapidly. This is one of the most common problems we see with traces that prevent PeakTrace from being able to improve the read length. If you don’t know there is a problem then it is very hard to fix.
  2. You may turn detector noise into something that looks like real peaks. This is a problem with KB and a potential problem with PeakTrace if the poor quality regions are not trimmed.

Conclusion

Extra normalization is an improved normalization added to PeakTrace 6 that improves the appearance of the PeakTrace basecalled trace file. It is recommended that it is used for all traces unless there is a particular need to use the previous normalization setting.

Filed Under: In Depth, PeakTrace, PeakTrace RP

In Depth: Automatic Bubble Spike Removal

November 30, 2015 By Daniel

Figure 3. Removal of spike peak by PeakTrace 6.12.

One production problem that can occur with Sanger DNA sequencing is sharp spikes in the raw data channel. These spikes can appear anywhere in the raw channel, are very intense and narrow (2 to 5 scans), with signal in all four channels of approximately equal intensity (Figure 1). These spikes are caused by a small gas bubble in the polymer moving past the sequencer’s CCD detector, causing the laser light to be refracted onto the CCD, leading to a sharp spike in raw signal.

Sharp spike caused by a gas bubble.
Figure 1. Example of a sharp spike caused by a gas bubble.

These spikes are often greater than the real peak signal and their presence can lead to problems basecalling the data. Figure 2 shows an example of what one of these sharp spikes can do to the true peak data. The base at the location of the spike can not be determined and the base ends up being called as an N or mixed base (H in this case).

Figure 2. Result of sharp bubble spike on the processed trace and basecall.
Figure 2. Result of a sharp bubble spike on the processed trace and basecall.

While these bubble spikes are a production problem that should be solved in the lab, they can be corrected in software using the PeakTrace Basecaller™ (6.12 and higher). Figure 3 shows the same trace file as shown in Figures 1 & 2, but basecalled using PeakTrace 6.12. The spike has been removed with the correct C base peak now clearly visible.

Figure 3. Removal of spike peak by PeakTrace 6.12.
Figure 3. Removal of the bubble spike peak by PeakTrace 6.12.

Pitfalls with using software correction of bubble spikes

While the sharp spikes caused by bubbles can in most cases be corrected in software, it is always best to fix the cause rather than using software to undo the damage. Relying on the basecaller to correct the spikes can result in you missing that you have a production problem. The best way to know if you have a bubble spike problem is to monitor the BUBBLE field of the QualTrace III log file. This field reports the number of strong sharp spikes found in the raw data channel. Significant rates of bubble spikes in production indicate a degassing problem of the polymer and/or buffer and should be corrected.

Conclusion

Sharp spikes are caused by production problems, but they can be corrected using the latest version of the PeakTrace Basecaller. It is important to monitor for the presence of “bubble” spikes by using QualTrace III so that production protocols can be corrected if an issue arises.

Filed Under: In Depth, PeakTrace, PeakTrace RP

PeakTrace 6.12 Linux x86_64 Released

November 27, 2015 By Daniel

We have released PeakTrace 6.12 for x86_64 Redhat/CentOS 6. This fixes a few minor bugs, but it does include one important improvement – bubble spike correction. Bubble spikes are sharp spikes in the raw data channel caused by small air bubbles in the polymer. When these small gas bubbles travel past the sequencer detection zone they refract the laser light onto the CCD detector. This causes a large, but very sharp spike in the raw channel. While these bubble spikes are a production issue that should be fixed by the operator, we are able to correct the problem in software, although not always in every case. This change has been incorporated into PeakTrace 6.12. The change list for this release is:

  • New Feature. Bubble spike removal.
  • Minor bug fixes.

PeakTrace 6.12 can be downloaded from the PeakTrace:Box Downloads page. If you do not have the password to access the downloads page please contact us @ {This email is obscured. Your must have javascript enabled to see it}.

Filed Under: linux, New Release, PeakTrace

Auto PeakTrace RP 6.12 Released

November 26, 2015 By Daniel

We have released Auto PeakTrace 6 RP 6.12. This is mostly a bug fix release, but it does contain one significant improvement – bubble spike correction. Bubble spikes are sharp spikes in the raw data channel caused by small air bubbles in the polymer. As the gas bubble passes by the detection zone they cause the laser light to refract onto the detector causing a sharp spike in the raw channel. While really a production issue that should be fixed in the lab, it is possible to (partially) correct the problem in software. This improvement has been incorporated into Auto PeakTrace 6 RP 6.12 and will also be in the next release of Auto PeakTrace 6. The change list is:

  • New Feature. Bubble spike removal.
  • Fixed a bug preventing a minus value being manually entered for good base improvement.
  • Other bug fixes.

Auto PeakTrace 6 RP 6.12 can be downloaded from the Nucleics Downloads page and is available for both Windows and Mac OSX. If you are a registered user of PeakTrace RP and you do not have the password to access the downloads page please contact us @ {This email is obscured. Your must have javascript enabled to see it}. If you are a new user then please register to use Auto PeakTrace 6 RP.

Filed Under: New Release, news, PeakTrace RP, windows

In Depth: Clean Baseline

November 24, 2015 By Daniel

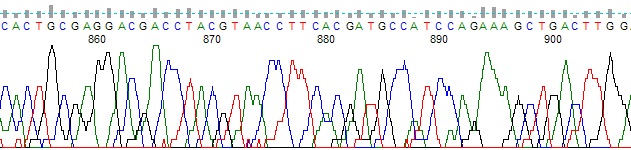
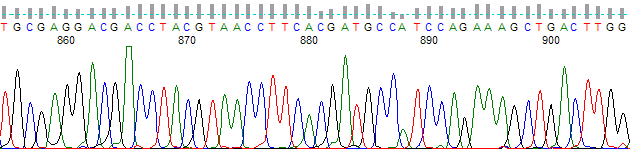
KB chromatogram from bases 855 to 905, with ragged, poorly shaped peaks

The clean baseline setting within the PeakTrace Basecaller™ is a cosmetic option that can be used to improve the appearance of trace files. While in an ideal world the end user of a DNA sequencing service should not care what the trace data looks like (only the quality and accuracy of the basecall), in practice providing your end users with traces that look “good” is very important. In an industry as competitive as DNA sequencing, every service provider needs every edge they can get and the clean baseline option can provide one such edge.

The best way to see what clean baseline can do is to look at some before and after examples.

Clean Baseline with KB Basecaller™ Traces

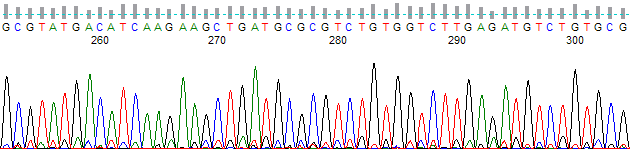
The clean baseline setting can be used with the KB Basecaller by post data collection processing of the KB trace file. This does not change or improve the actual basecalling as PeakTrace does, but it does make the peaks look better. Figure 1 shows a typical example of a typical “noisy” KB trace. In this example the actual basecall is fine, but the trace does not look very nice, since there is a significant amount of secondary signal under every primary peak.

KB basecalled trace at position 300
Figure 1. Example “noisy” KB basecalled trace.


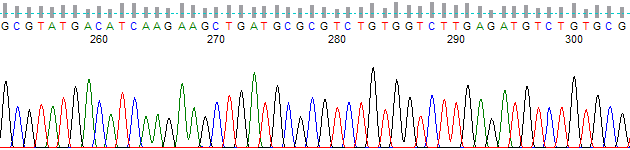
Figure 2 shows the same KB trace after clean baseline processing. The basecall is identical to that shown in Figure 1, but the trace now looks much better. Nothing has changed, except the appearance of the trace. From the end user’s perspective, the trace is better.

KB basecalled trace after clean baseline processing.
Figure 2. Example “noisy” KB basecalled trace after applying clean baseline processing.

Clean Baseline with PeakTrace Basecaller™ Traces

The best way to use the clean baseline option is with the PeakTrace Basecaller. Figure 3 shows a section of an example KB trace file at base 900. The appearance of the peaks is very poor and much of the sequence data of low quality.

KB trace file at base 900
Figure 3. Example KB basecalled trace file at base 900.

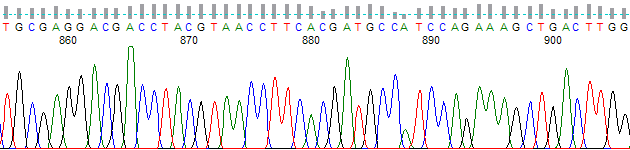
Figure 4 shows the same trace file, but after PeakTrace basecalling. While the trace is visibly better than the original KB trace file, it does have an amount of secondary peaks (noise) under the primary peaks.

PeakTrace chromatogram of the same trace from bases 855 to 905, with clearer peaks and some secondary noise peaks underneath
Figure 4. PeakTrace trace file at base 900.


Figure 5 shows the same trace file basecalled using PeakTrace, but using the clean baseline option. The basecalls and quality are the same as in Figure 4, but the trace looks cleaner with no secondary noise peaks under the primary peaks.

PeakTrace with Clean Baseline
Figure 5. PeakTrace trace file after clean baseline processing at base 900.


Potential Pitfalls with using Clean Baseline

While the clean baseline option is a very useful tool for improving trace appearance, there are a couple of potential downsides to using it. It can hide from the sequencing facility operator production issues that may be occurring. It is advised that if the clean baseline option is used that the QualTrace III and/or Trace Reports are carefully inspected to identify problems that might be hidden by using clean baseline.

Conclusion

Clean baseline is a powerful setting new to Auto PeakTrace 6 that can help improve the appearance of both PeakTrace and KB .ab1 trace files. While not affecting the base or quality score, the improved appearance of the resulting trace files provides facilities with a competitive edge when marketing to end users.

Filed Under: In Depth, PeakTrace, PeakTrace RP

Why is the default Good Base Improvement −20?

November 20, 2015 By Daniel

Good Base Improvement

Auto PeakTrace Options panel with good base improvement set to −20

A question we occasionally get asked is why is the default good base improvement set to −20? The reasons are complex, but it is basically due to the way KB overcalls good bases. The purpose of the good base improvement setting is to allow processing of only those traces that are able to be improved by PeakTrace. This enables us to only charge you for the traces that are improved and not charge you for failed reactions, short PCR products, etc.

How can you determine which traces have been improved by PeakTrace?

Since a KB predicted Q20+ base is not the same as a PeakTrace predicted Q20+ base, just counting predicted Q20+ bases does not allow you to know if the basecall is actually better or not (i.e. if there are more measured Q20+ bases or not). There are three solutions to this problem:

  1. Add a correction factor to the PeakTrace quality score values (i.e. add 3 to every Q value in the Q17 to Q27 range). This way when we are comparing KB to PeakTrace predicted quality score counts we are making an apples-to-apples comparison. The downside of this approach is that PeakTrace would then overcall all the bases in the Q17 to Q27 range.
  2. Subtract a correction factor from the KB quality score values (i.e. minus 3 from every Q value in the Q17 to Q27 range). The downside of this approach is the reported Q20+ count would not match any external count, breaking downstream scripts and analysis.
  3. Set the comparison (good base improvement) such that it takes into account KB’s overcalling. Using this approach a .ab1 file would be accurately identified as being improved by PeakTrace (i.e. have more real Q20+ bases), despite having fewer predicted Q20+ bases.

While none of these three approaches are ideal (the ideal would be for ABI to correct KB’s overcalling), the third approach is the least disruptive. Our analysis has identified −30 as the equivalence point for comparisons between KB and PeakTrace basecalled traces (i.e. a PeakTrace trace with ~30 fewer predicted Q20+ has as many real Q20+ bases as the original KB trace). Because we wish to be conservative, we have set the default for good base improvement to be −20 so that only traces that are improved by at least 10 real Q20+ bases are accepted. You can be even more conservative than the default value and set the good base improvement as high as −10 without getting charged for non-improved traces, however, any higher than this will result in you being charged.

The bottom line is that you shouldn’t set the good base improvement higher than −10 if you want to get the best out of PeakTrace.

Filed Under: How-to, PeakTrace, PeakTrace RP

Auto PeakTrace RP and the Good Base Improvement Setting

November 19, 2015 By Daniel

Just a quick update on how Auto PeakTrace RP charges for traces processed. Officially it has always been that if you set the good base improvement to a value greater than −10 (i.e −9 and higher) then you would be charged for traces that are not improved by PeakTrace. This rule was to stop the abuse of the PeakTrace server, as well as to encourage users to set sensible values (the default −20 is best). Setting the good base improvement to a value higher than −10 is far from optimal.

We have until now not enforced this rule, but unfortunately some people have not used this freedom sensibly and so we have reluctantly started enforcing this rule. If you have been using a good  base improvement value of greater than −10 then we highly recommend setting it back to a value below this (i.e. the default −20 is best).

One final tip. If you are having problems entering a negative number in the good base improvement box you can do it by pressing the reset button on the options window and then modifying the number, or by copying and pasting in the negative value from a text document. We will be making it easier to enter a negative number for this value in the next release.

Filed Under: macosx, PeakTrace RP, windows

Automatic updates of Auto PeakTrace 6

November 13, 2015 By Daniel

We have updated the automatic update system so that it now supports Auto PeakTrace 6 updates. This means if you are running Auto PeakTrace 6 then it will suggest when an update is available provided you have the check for updates option selected. This feature is available for Auto PeakTrace 6.11 and greater.

Unfortunately, because you need a license upgrade to move from Auto PeakTrace 5 to Auto PeakTrace 6 it is not possible to automatically upgrade from PeakTrace 5 to PeakTrace 6. If you are still running Auto PeakTrace 5.92 or earlier you can upgrade manually to Auto PeakTrace 6 by following the instructions shown.

Filed Under: news, PeakTrace, windows

Auto PeakTrace 6.11 Released

November 12, 2015 By Daniel

We have released Auto PeakTrace 6.11. This is just a small bug update release to fix an interaction issue with mixed basecalling and trace trimming. It is recommended that all licensed users of Auto PeakTrace 6 upgrade to this release.

It can be downloaded from the Nucleics Downloads page. If you need the password to access the downloads page please contact us @ {This email is obscured. Your must have javascript enabled to see it}.

Filed Under: New Release, PeakTrace, QualTrace, windows

  • « Go to Previous Page
  • Page 1
  • Interim pages omitted …
  • Page 10
  • Page 11
  • Page 12
  • Page 13
  • Page 14
  • Interim pages omitted …
  • Page 22
  • Go to Next Page »

Primary Sidebar

DNA Sequencing Help

We have added a guide on troubleshooting automated DNA sequencing problems.

DNA Sequencing Service Facilities Reviews

Please see our review of 325 DNA sequencing core facilities and commercial services for more information on selecting the right sequencing service for your needs.

QualTrace III Online

Try the free online version of the QualTrace DNA sequencing QC software and see how real time quality control tracking can improve your read lengths and lower sequencing failure rates.

Contact Details

email. information@nucleics.com
phone. +61 489 152 658
  • home
  • peaktrace
  • software & reagents
  • forum
  • tools
  • services
  • support
  • about

Nucleics

Sanger Sequencing Software

Already have RP units? Run batches in your browser with PeakTrace Online Pro.

©Nucleics 1999 - 2026