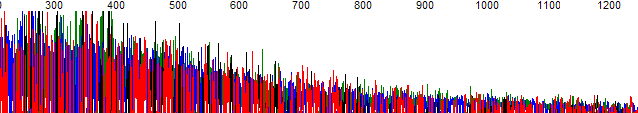
One of the more commonly misunderstood settings within PeakTrace™ is true profile. By default PeakTrace uses a flat profile which normalizes the processed peaks to approximately the same height irrespective of the true signal intensity in the raw data channels (Figure 1).
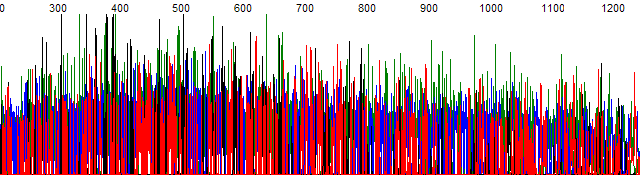
Figure 1. Example trace following basecalling and processing with PeakTrace under default settings.
The true profile setting of PeakTrace works in exactly the same way as the True Profile setting within ABI’s Sequence Analysis software. Selecting true profile outputs traces where the processed peak heights reflect the underlying peak intensity in the raw trace data channels. When traces are processed using true profile, samples that show a large peak signal decline will have large peaks at their 5′ ends which tapers off to small peaks or baseline noise at the 3′ end (Figure 2). The use of true profile will ensure that the processed peak signal reflect the signal strength profile seen in the raw trace data (Figure 3).
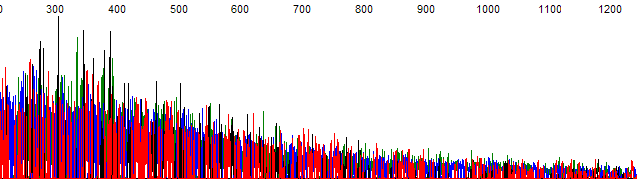
Figure 2. The same example trace as shown in Figure 1. with true profile selected
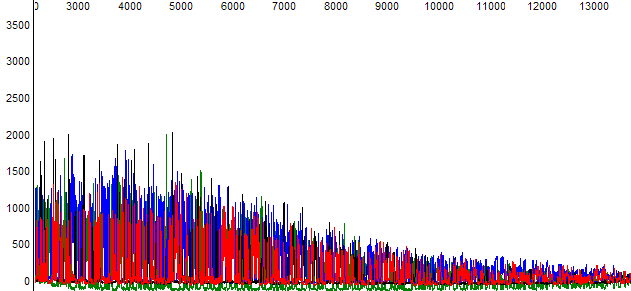
Figure 3. The raw data from the example trace shown in Figures 1 and 2.
The main advantage of using true profile is it allows users to quickly visualize any problems stemming from rapid peak signal decline. This can prove useful in helping identify problems that have occurred in sample preparation which the flat profile may hide. The default for true profile is off.
Potential Pitfalls with using True Profile
The major pitfall with using true profile is the peaks at the 3′ end of the trace can be very small if the trace signal declines very rapidly (i.e. a so called “ski-slope” trace).
It is important to note that true profile will not be set if extra normalization is also chosen. Be sure to uncheck extra normalization if you want to output the true profile.