One of the less obvious setting in PeakTrace is using a mixed peak threshold value over 100%. The mixed peak threshold controls the value at which as basecall with a secondary peak is called as a mixed base. For example, if the mixed peak threshold is set to 40% then any peaks with a secondary peak 40% or greater than the height of the primary peak will be called as a mixed (degenerate) base.
A secondary function of the mixed peak threshold value is controlling the removal of secondary peaks smaller than the threshold value when using the clean baseline and extra baseline options. If a mixed peak threshold value of 20% is used along with extra baseline and clean baseline then those secondary peaks smaller than 20% of the primary peak will be removed from the trace. Any peaks with a secondary peak higher then the threshold value will be called as a mixed base.
If it is desired to keep the secondary peaks above a certain size, but not call the peaks as mixed/degenerate then using a mixed peak threshold over 100% will enable both the minor secondary peaks to be removed and the major secondary peaks to be kept while the primary peak is called as the base.
Figure 1 shows an example of a trace with a significant amount of noise, but also some true mixed peaks. These can be very difficult to detect in noisy traces as the processing KB performs on the raw data can remove or change the height of both true peaks and noise peaks.
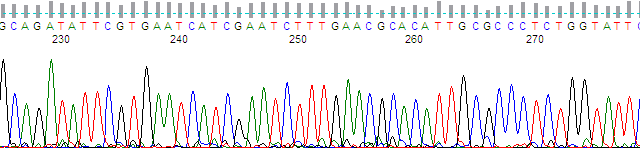
Figure 1. KB Basecaller™ processed region
Figure 2 shows the same peak region but processed with PeakTrace no peak resolution processing. This processing mode outputs the raw data with minimal processing (signal baseline and dye mobility shift correction) enabling the true peak data to be examined. A complex pattern of secondary peaks is observed in Figure 2 that are missing from the KB trace.
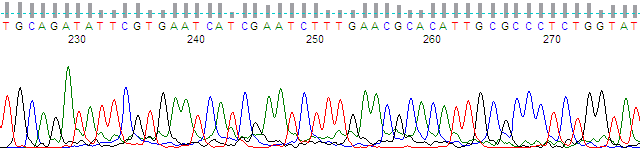
Figure 2. Raw data (no peak resolution).
Figure 3 shows the same region processed with standard PeakTrace basecalling and processing. While the secondary peaks are better separated from the noise peaks and have heights that correspond to the peak heights seen in the raw data, many of these secondary peaks are small and not significant mixed bases.
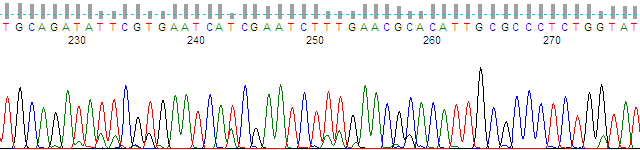
Figure 3. Standard PeakTrace processing and basecalling.
Figure 4 shows the same trace region but with the mixed peak threshold set to 40% with clean baseline and extra baseline used. While only the large secondary peaks are retained the basecall contains degenerate/mixed basecalls.
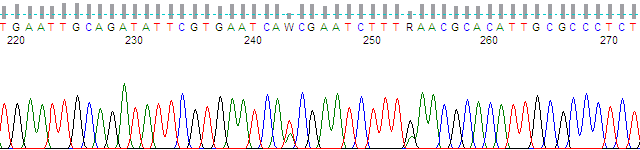
Figure 4. PeakTrace with mixed basecalling at 40% with clean baseline and extra baseline.
Figure 5 shows the same region but using a mixed peak threshold of 140% along with clean baseline and extra baseline. The trace looks the same the 40% trace (i.e. only the major peaks are retained), but the basecall does not contain any degenerate/mixed basecalls. The basecall at the degenerate position is set to the primary peak call.
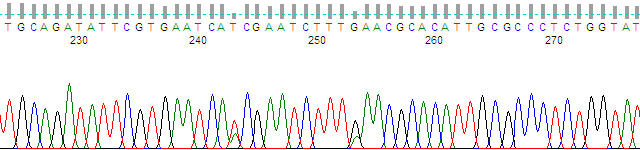
Figure 5. PeakTrace with mixed basecalling at 140% with clean baseline and extra baseline.